Enginuity Future Skills Hub
Engineering and manufacturing is rapidly transforming, making it hard for employers to know what skills they need to keep pace with change. The Enginuity Future Skills Hub aims to demystify the skills, trends and transitions reshaping industries within the UK’s engineering and manufacturing sector.

What is data analysis and visualisation?
Data analysis and visualisation involves collecting, examining and presenting data to derive actionable information and business insights.
Data analysis uncovers patterns, trends, or correlations, while data visualisation uses graphs or charts to communicate findings effectively.

Data analysis and visualisation explained
How is data analysis and visualisation used?
Data analysis and visualisation is used in many ways, including production analysis, supply chain and market analysis, workforce productivity, and safety monitoring. Examples include:
- Identifying production patterns related to product quality, and equipment and machinery performance
- Evaluating demand patterns, inventory levels, and lead times
- Analysing energy consumption and compliance with regulations
- Supporting cost analysis and budgeting
- Analysing customer feedback and satisfaction, tracking market trends, and evaluating competitor performance.
- Assessing workforce productivity and safety metrics.
Benefits of analysis and visualisation
Analysis and visualisation and Industry 4.0
Analysis and visualisation and sustainability
What skills might you need?
Skills needed for data analysis and visualisation include proficiency in data manipulation, statistical analysis, and data visualisation tools such as Tableau or Power BI. Additionally, expertise in programming languages such as SQL, Python, or R, and domain-specific knowledge in engineering or manufacturing processes are useful for deriving actionable insights from large datasets and communicating findings effectively to stakeholders.
Other specific skills include:
- Data analysis
- Data management
- Data modelling
- Data mining
- Data science
- Data warehousing
- Database design
- Information security
- Problem management
- Project management
- Change management
- Visualisation
- Stakeholder relationship management
Who might need them?
While not everyone in the organisation may need advanced skills in data analysis and visualisation, there are certain roles and functions where these skills are particularly valuable, including:
- Data analysts and scientists
- Business intelligence (BI) and analytics specialists
- IT and database professionals
- Project managers and leaders
- Quality control and process improvement specialists
- Operations and supply chain management
- Decision-makers and executives
- Frontline workers.
Useful resources

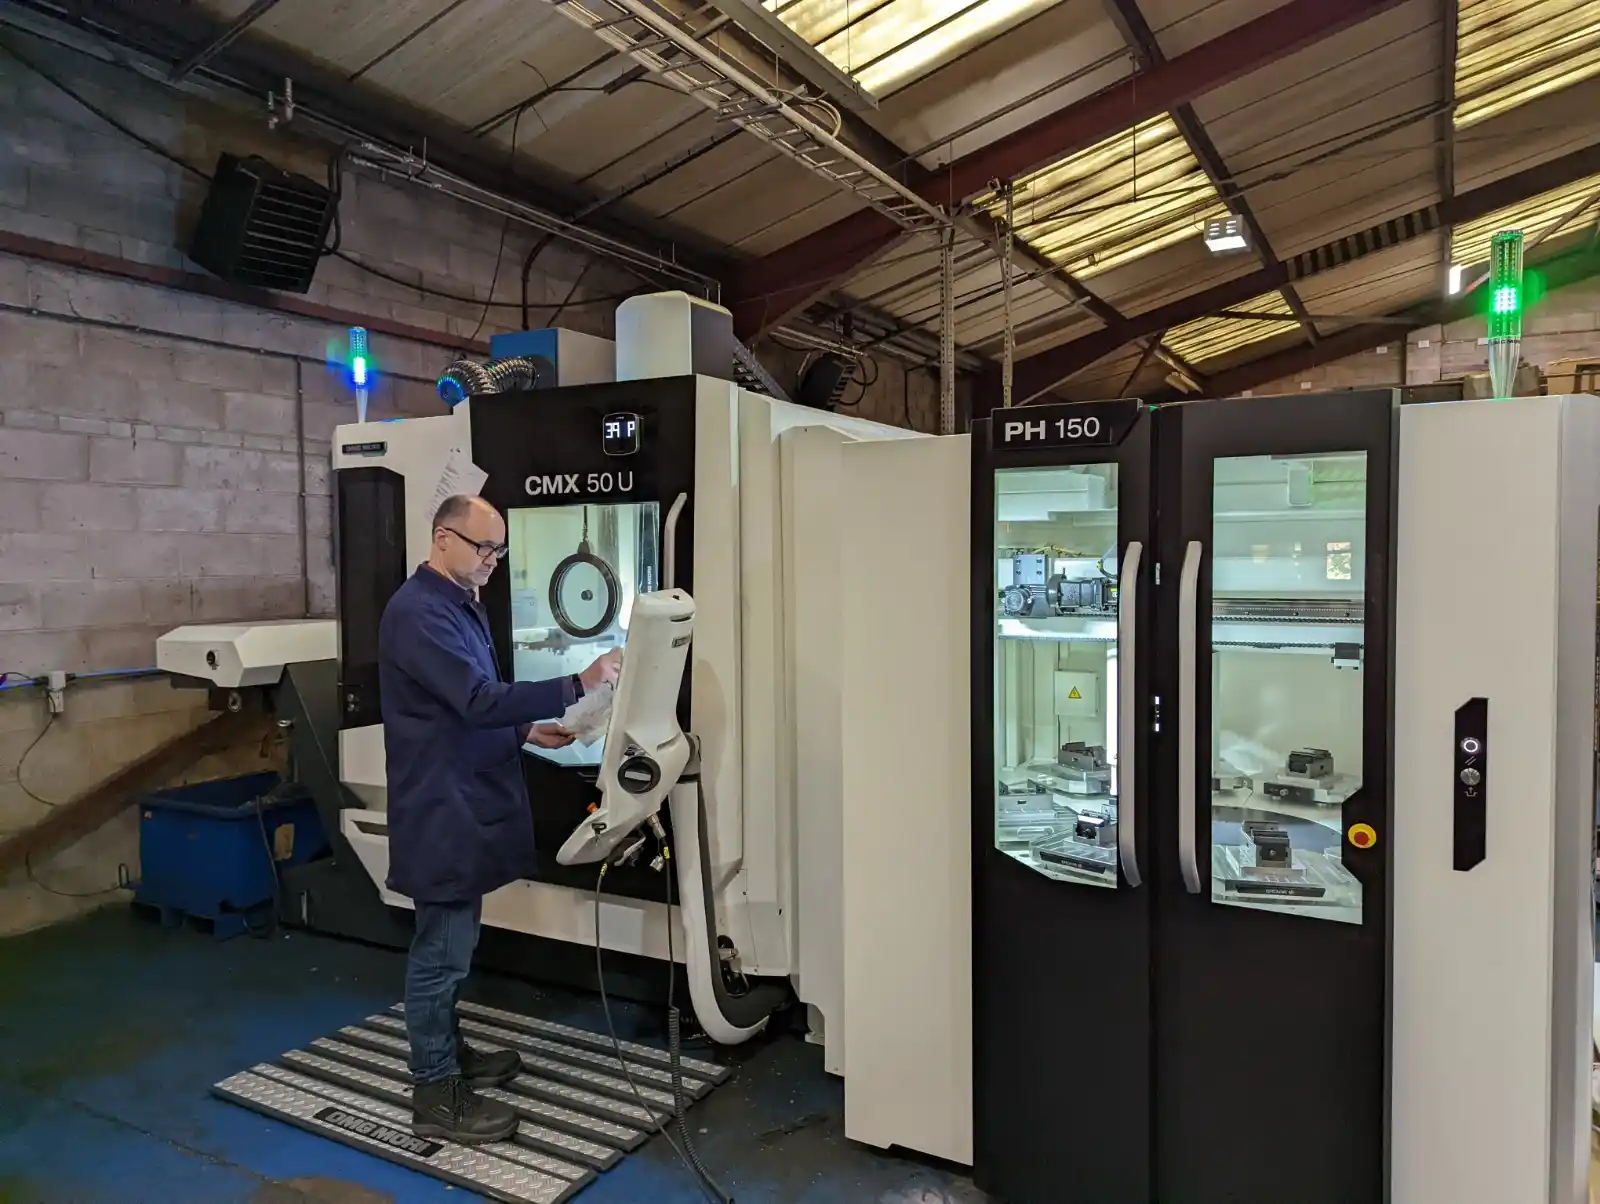
Barrs Court Engineering
Discover how this precision engineering company developed the skills needed in the workforce to adopt digitalisation in the factory.
Read more
Dig a bit deeper?
Visit Skills for the Information Age (SFIA), the global skills and competency framework for the digital world.
Read more